


The information in this report was obtained from Auto Laundry News’ “Full/Flex Conveyor Surveys” for the years 2014 through 2025.
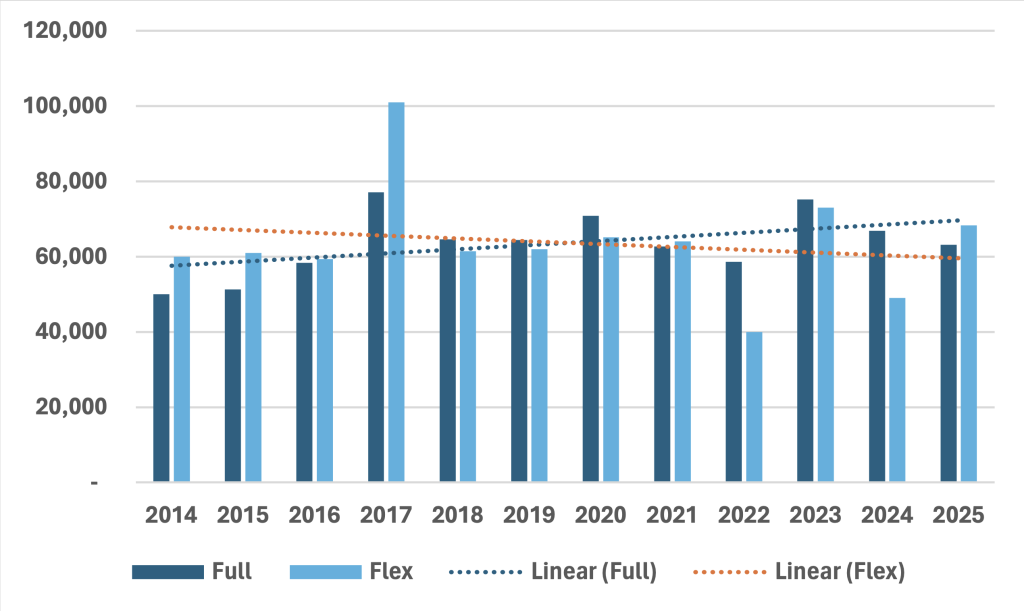
Figure 1 – Cars washed per year.
There is a slight upward trend in full-service car count and a slight downward trend in flex-serve volumes (not statistically significant).
The average and median of the period for both product classes coincided at roughly 63,000 cars per year (Figure 1).
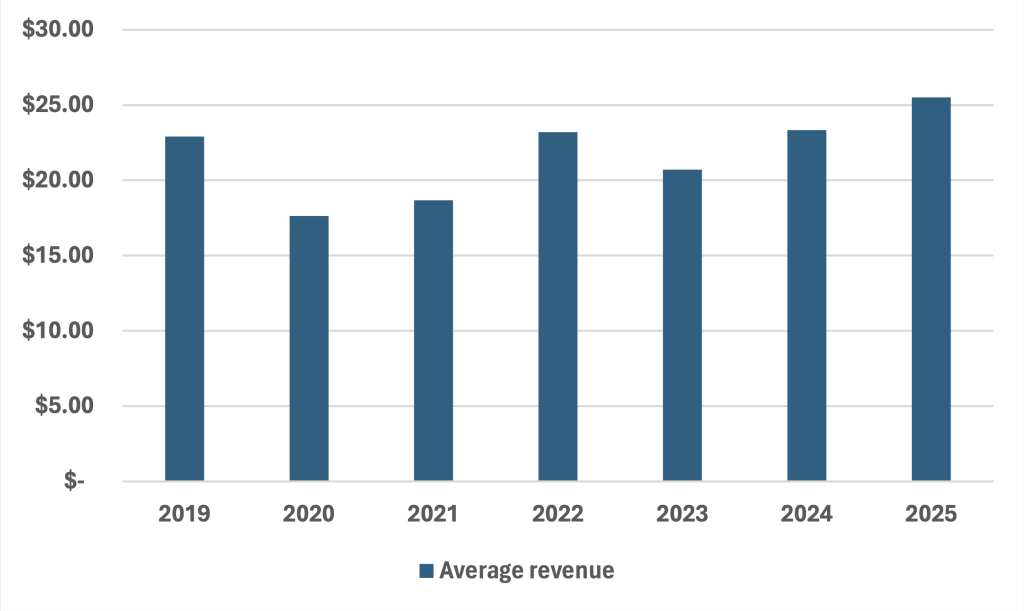
Figure 2 – Average per car revenue.
If we omit 2019, there has been an almost $7 increase in average revenue over a six-year span (Figure 2). During this period, extra online services sold ranged from 17 percent to 31 percent (more than 60 percent of cars washed).
Extra services offered by 100 percent of full-service sites include detailing, carpet shampoo, and hand wax. One hundred percent of flex-service sites offer detailing and upholstery cleaning.
The next most common extra service is exterior protection (80 percent). There has been a definite increase in the percentage of operators using lava application, paint sealant, and ceramic.
Historically, the most common non-auto, on-site profit centers have included coffee bar (50 percent), ATM (42 percent), and greeting cards (42 percent).
Arguably, average revenue has also been affected by the price of extra services. Here, the average price for a complete detail at a full-service wash has increased from $150 in 2013 to $283 in 2025, a 89 percent increase.
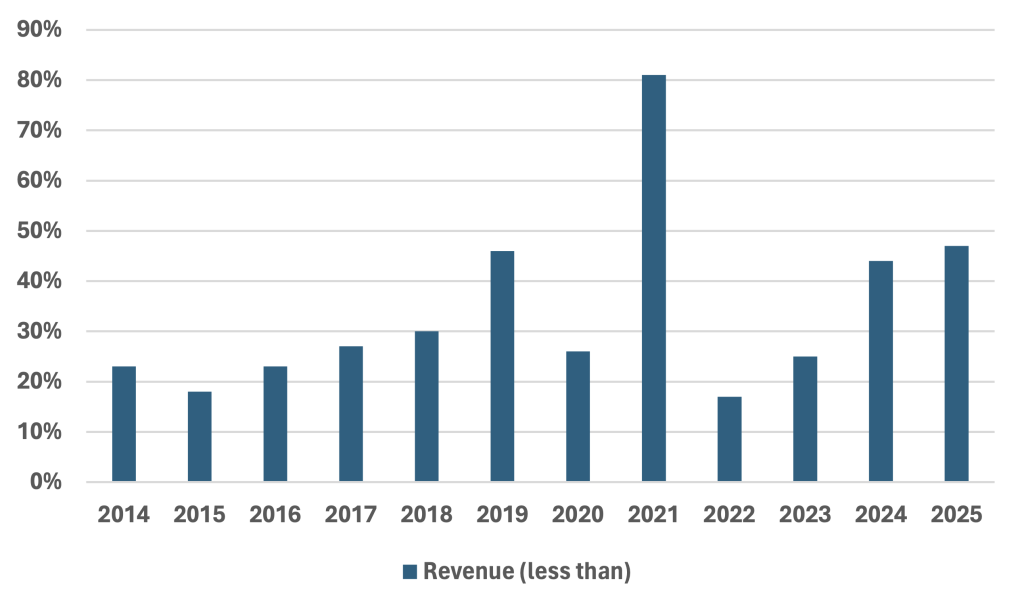
Figure 3 – Revenue trend.
Despite the upward trend in average ticket price and excluding pandemic-related irregularities, there is a subtle increase in the percentage of operators reporting lower income than the previous year (Figure 3).
According to responses to ALN’s open-ended questions, reversal of fortunes in 2021 and 2022 were COVID-related; in 2023 and 2024, it was supply chain issues; and in 2025, it was competition.
The most common negative word was oversaturated ― many full- and flex-serve operators believe that the exterior-only market has become overbuilt and crowded. According to responses for competing washes in the area, the average number increased from 2.84 in 2015 to 3.38 in 2025, or a 19 percent increase.
Conversely, there has been no significant change in how far customers are willing to travel to the wash. Around 70 percent come from 5 miles or less and 80 to 90 percent come from 10 miles or less.
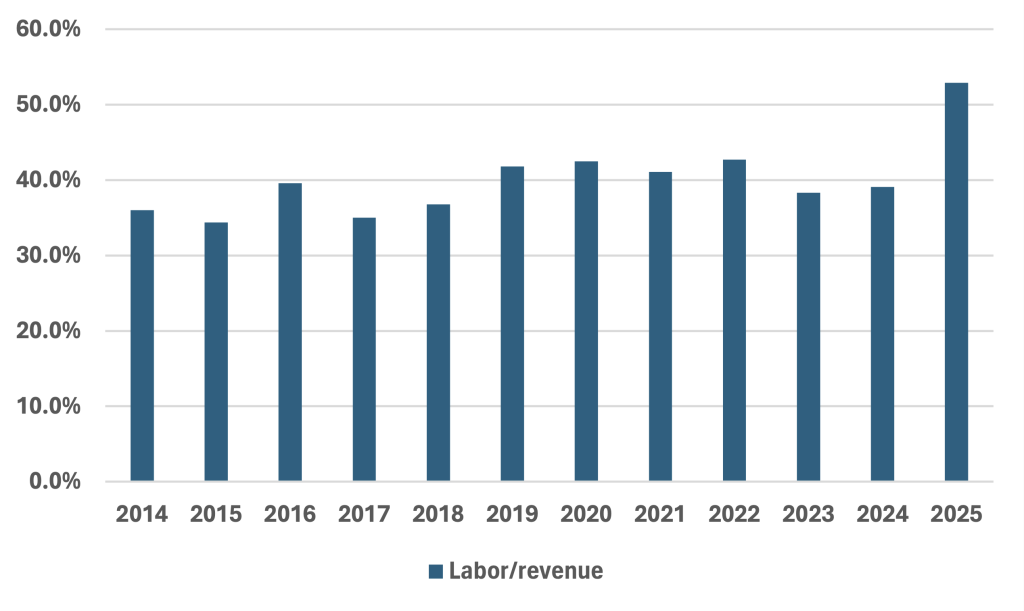
Figure 4 – Labor as percentage of sales.
Labor is by far the most significant expense that operators face. We have observed a slight upward trend in labor cost as a percentage of total revenue with a material bump reported last year (Figure 4).
Arguably, some of this can be attributed to employee wages. For example, back in 2014, 43 percent of operators reported paying $8.00 to $10.00 an hour, and only 10 percent paid more than $10. In 2025, 31 percent paid $12 to $15 an hour, and 44 percent paid more than $20.
Arguably, some of this can be attributed to recruiting. ALN has several years of data related to this subject; most operators (over 80 percent) report that recruiting is difficult or very difficult.
The methods used to reach customers have also changed considerably. Back in 2014, 40 to 50 percent of operators advertised with ads in newspapers, direct mail, and radio. By 2025, this trend had fallen to about 25 percent.
In 2014, social media use ranged from 45 to 55 percent. In 2025, it’s between 50 and 87 percent. In 2014, internet access was 85 percent, and 61 percent of operators had a website. In 2025, this was 100 percent and 91 percent, respectively.
Bob is an industry consultant with more than 25 years of experience and is a former operator of car wash, oil change, and detail businesses. He can be reached at (727) 723-9474 or bobr427@protonmail.com.